
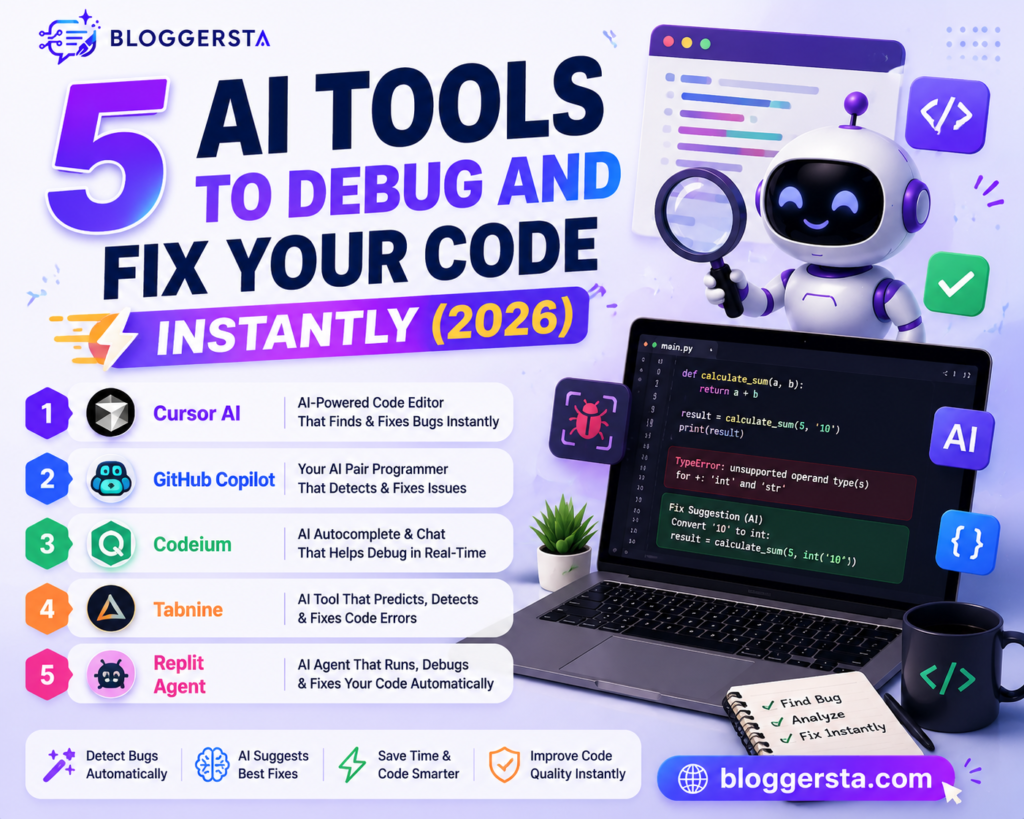
There is little more frustrating than spending hours looking at a terminal error, trying to find a malware semicolon, or tracking a memory leak just before the deadline. Small mistakes in code can translate into large delays as well.
This is why many developers use AI code debugger tools to speed up their troubleshooting. These tools can review code, identify logic and execution errors, and instantly provide working fixes. AI can help identify problems quickly and fix code errors instead of manually searching through hundreds of lines of code. In this guide, we will look at five top tools and compare them in terms of debugging accuracy, logic analysis, terminal integration, privacy features, and overall performance.
- Detect syntax, runtime, and logic errors faster.
- Get AI-powered fixes with clear explanations.
- Save time and improve coding productivity.
Static vs. Semantic Analysis: Can AI Debug My Code Safely?
Yes, an AI code debugger can indeed help to debug your code safely, but it should not be fully trusted. Traditional debugging takes an extra step with better tools that can analyze code, establish syntax errors, and identify structural problems based on strict definitions. The safest way is to use both methods together, so that AI suggestions can be checked before use.
| Feature | Static Analysis | AI Semantic Analysis |
| How It Works | Uses predefined rules and code structure checks | Understands code context and logic |
| Best At Finding | Syntax errors, missing brackets, memory issues | Logic bugs, code flow problems, architecture issues |
| Business Logic Understanding | Limited | Better understanding of intent |
| Reliability | Consistent and predictable | Can sometimes make mistakes |
Why AI Debugging Needs Human Review
- AI May Suggest Inappropriately: Sometimes suggests old libraries or functions do not exist.
- Business Rules May Not be Sufficiently Understood: AI doesn’t know exactly what you are trying to achieve with your project.
- Potential Vulnerability: A recommended solution might introduce a new weakness.
- Review Changes: Always check and test AI suggestions before deploying them in the production environment.
Also read: 5 Best No-Code AI App Builders for Entrepreneurs (2026)
Top AI Code Debuggers At a Glance
AI code debugger tools exist to provide a mechanism to identify issues more quickly, provide insights into the root cause, and recommend solutions to address bugs before they make it into Production. Which platform is best depends on the type of errors you handle, your development environment of choice, and how much privacy you require.
| Software Name | Best Bug Targeting Specialty | IDE Integration Type | Telemetry Privacy Mode | Free Version Available? |
| GitHub Copilot | Code errors and refactoring issues | VS Code, Visual Studio, JetBrains | Enterprise privacy controls | Limited |
| Cursor | Multi-file debugging and codebase analysis | AI-native VS Code fork | Configurable privacy settings | Free Trial |
| Codeium | Syntax errors and daily code fixes | VS Code, JetBrains, Vim, Neovim | Privacy-focused policies | Yes |
| Tabnine | Secure enterprise debugging | VS Code, JetBrains, Eclipse | Local and private deployment options | Yes |
| Amazon Q Developer | AWS application debugging | VS Code, JetBrains, AWS IDEs | Enterprise-grade security controls | Yes |
How Do I Find Errors in Code Using AI?
AI code debugger can find coding errors in a considerably shorter amount of time, yet the quality of the subjects to work with comes down to the types you provide. Executing this process allows you to correctly have debugging done by any online code reviewer AI.
1. Identify the Broken Code Section
Duplicate the exact function, file, or code that triggers the issue. And do not just provide the error line(s), but the entire compiler messages/runtime errors or stack trace.
2. Provide Your Development Environment
Tell the AI what technologies it prefers, for example, Python 3.11, React 18, Node. js, Java, or. NET. This allows the tool to generate fixes that work in your environment.
3. Request a Full Error Analysis
You may get AI to look at the code for logic bugs, edge cases, NULL pointer issues, memory leaks, dependency conflicts, and performance problems.
4. Review the Suggested Fix
Double-check the proposed solution before doing anything. AI may misinterpret business rules or propose changes that are not required.
5. Test Before Deployment
Test the AI-generated patch in an isolated test environment and ensure all unit tests pass before rolling those updates into your production codebase.
Reviewing the 5 Best AI Code Debugger Solutions
The modern AI code debugger toolkit does so much more than simply flag syntax errors. The top-notch platforms can analyze your project structure, identify security issues, and trace logic errors while also implementing operational fixes at the same time. Here are five top solutions that were tested for speed, safety, code analysis quality, and overall developer productivity.
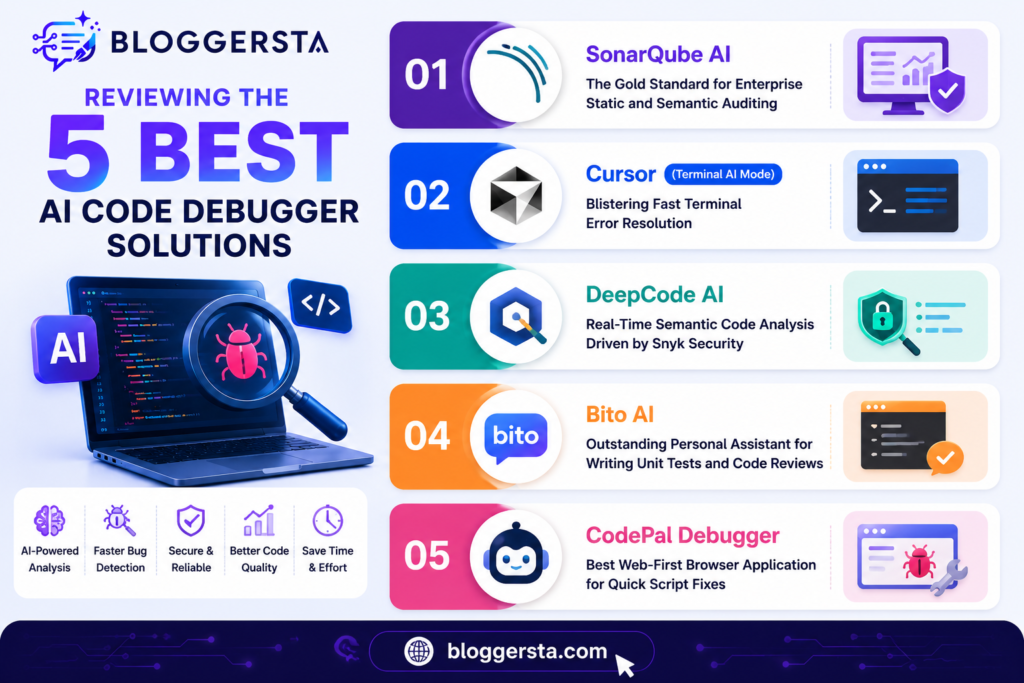
1. SonarQube AI – The Gold Standard for Enterprise Static and Semantic Auditing
Enterprise engineering teams trust SonarQube AI to stop bugs, security vulnerabilities, and bad code practices before the code reaches production. It can be directly integrated into CI/CD pipelines and can scan pull requests automatically throughout the software development life cycle.
That helps teams perform code reviews in an intelligence-based manner, maintain consistent code quality, and reduce production issues that cost you dearly. Its clear privacy controls and secure deployment options are also popular among teams who work on sensitive projects.
- Feature: Code quality gates have direct access to production servers and prevent bad builds from going out.
- Pros: Treats multi-language security scanning, good privacy protection, low false-positive rates.
- Cons: More expensive tiers, some basic DevOps sense needed for setup.
Technical Prompt Template
- Analyze this code for:
- Logic errors
- Security vulnerabilities
- Performance bottlenecks
- Code quality issues
- Propose a fix for each of these problems along with the reason that made it happen.
2. Cursor (Terminal AI Mode) – Blistering Fast Terminal Error Resolution
Cursor is designed for developers who value faster debugging workflows. It was built on top of VS Code; it knows all the files you are working on and highlights problems scattered across multiple files rather than just a single script.
When a build breaks, developers can pipe terminal errors directly into Cursor’s AI sidebar. It detects the error, finds the correlated files, & creating a working fix within seconds.
- Feature: Codebase indexing locally, maps errors to related files and dependencies on connection.
- Pros: Relevant, Helpful, Project-wide visibility, Better for multi-file fixes
- Cons: Advanced features belong in paid plans and consume more system resources in large projects.
3. DeepCode AI – Real-Time Semantic Code Analysis Driven by Snyk security
DeepCode AI is an on-the-go security flaw and hidden logic error descriptor in your code. Built using the Sage security engine from Snyk, it can continuously scan projects and provide real-time recommendations.
In contrast to traditional linters, it understands how files interact within the repository and helps a developer find problems that even manual reviews miss.
Feature Checklist
- Automated memory safety scanning
- Cross-file logic analysis
- Real-time security vulnerability detection
- Instant patch recommendations
- Continuous code monitoring
4. Bito AI – Outstanding Personal Assistant for Writing Unit Tests and Code Reviews
Built for individual developers who want a simple way to fix bugs and generate tests directly in VS Code, Bito AI is getting attention. Explain the code and identify problems in it by automatically generating unit tests.
Debugging, in its simplest terms, is easy to understand even for novice programmers, yet offers enough detail for advanced programmers.
| Pros | Cons |
| Easy-to-use debugging assistant | The free plan includes usage limits |
| Generates unit tests automatically | Advanced features require upgrades |
| Supports code reviews and explanations | Less enterprise-focused |
| Works directly inside IDEs | Not designed for large-scale security auditing |
5. CodePal Debugger – Best Web-First Browser Application for Quick Script Fixes
The browser-based AI code debugger, CodePal Debugger, is perfect for beginners and students, as they do not need to install any extensions or development tools.
Users paste their code, and the website gives them explanations, fixes if it finds a bug, or ways to improve it. This feature is what makes it well-suited for learning programming concepts.
- Feature: Detailed line-by-line debugging explanations tailored for students and novice developers
- Pros: beginner-friendly with web-based access and straightforward explanations.
- Cons: Not as good for project-wide analysis as IDE-based debugging platforms.
Maintaining Code Ownership and security While Debugging
Fixing bugs is not the only concern when using an online code reviewer AI; it is also about protecting your source code. Implement these easy practices to keep your projects safe during debugging.
- Remove All Sensitive Data: Strip out passwords, database connection strings, and any other sensitive information from the code before uploading it to an AI debugging tool. Use placeholder values whenever possible.
- Do Not Copy and Execute Automated Fixes Without Checking Them: Review AI-generated fixes with caution. Confirm the logic, develop test cases for it, and ensure it does not introduce new bugs, performance degradation, or security issues.
- Turn Off Public Sharing Settings: Review your account’s privacy settings and disable options that allow submissions containing code to be saved or used for models. It helps you to keep proprietary code private.
- Test Prior to Production Deployment: Test any AI-generated fixes in the development or staging environment before deploying them against your production application. That decreases the likelihood of unforeseen breakdowns.
Also read: 5 Best AI Coding Assistants for Beginners and Pros (2026)
Frequently Asked Questions
1. What are the top 5 AI tools for coding?
Best AI coding tools in 2026: GitHub Copilot, Cursor, SonarQube AI, Bito. The platforms assist with code generation, debugging, testing tools, and development productivity.
2. What is the best AI code tool in 2026?
The best AI coding tool is Cursor (as mentioned above) because it integrates code generation, debugging, project-wide understanding, and editing of multiple files in a single development IDE.
3. Which AI tool is best for debugging code?
SonarQube AI is one of the most effective debugging tools on the market for professional teams. It integrates directly into development and CI/CD workflows and detects security issues, logic defects, and code quality problems.
4. What are AI short questions?
AIs are short prompts you can use to get rapid responses from artificial intelligences. And you would often see them used for coding help, debugging, research, and troubleshooting, as well as a faster way to learn technical concepts.
Conclusion: Maximizing Engineering Velocity with Automated Debugging Systems
AI code debugger has changed dramatically over the last few years. Developers can spend time on system design, testing, and validating much faster rather than spending long hours scanning hundreds of lines of code for hidden errors. An ideal AI code debugger determines bugs, clarifies root causes, and creates fixes in seconds. But the right tool will depend on your project size, the number of bugs you need to debug, and data privacy laws. No matter if you want IDE-based support or enterprise-grade code analysis — modern AI tools can make development workflows much faster.
Use Cursor: blazing fast AI-assisted debugging with deep understanding of your codebase.
SonarQube: Precise code quality, security scanning, and automated reviews
Up next: Create an account for free, drop your hardest code error in the developer, and see AI solve it faster than you